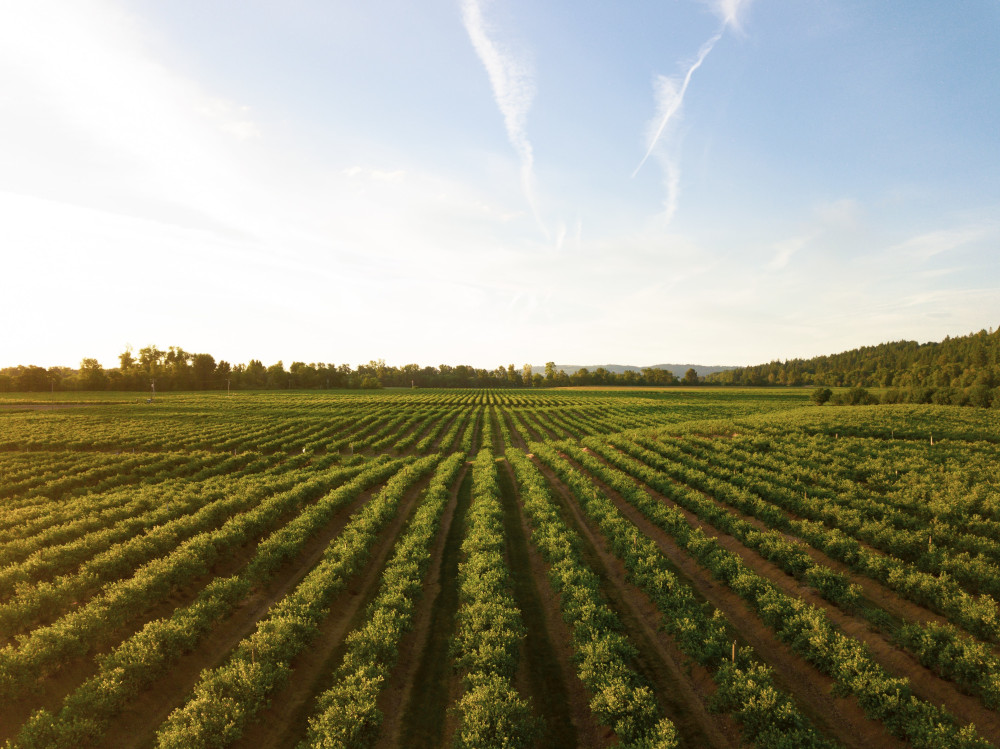
Paying attention to metrics always improves performance and farming is no exception. When agronomists track the use of resources (fertilizers, pesticides, water) based on accurate data, they end up saving up both resources and money. Detailed measurements have become more accurate and useful in modern agriculture, helping farmers cut costs while reducing negative impact on the environment.
To cultivate their crops more efficiently, farmers can use a variety of measurements, gathering different information on the land and state of crops. So, what are those measurements? Where do they get them? The answer is vegetation indices. Using the combination of different VIs, farmers can gather all the necessary information they need for effective decision-making. Besides, this information is easily accessible via a variety of online tools that provide data on previously analyzed vegetation. But first, let’s dig deeper into the definition of vegetation and how it can be analyzed.
Vegetation Analysis: Indices and Remote Sensing
Vegetation is the ground cover the plants provide, and a vegetation index is a number that quantifies vegetation within a pixel. The data for analysis is retrieved from satellite imagery, extracted by a specific algorithm of a chosen tool. The technology behind it is mathematically combining a number of spectral bands based on physical vegetation parameters, primarily the absorption of more light in the red (R) than in the near-infrared (NIR) region of the spectrum. Different indices can provide information on not only plant health but also soil quality, climate patterns, drought monitoring, and more.
The differences in response patterns of vegetation in the RED and NIR enable the calculation of the most commonly used vegetation index – NDVI. Normalized Difference Vegetation Index is a great example of a vegetation index that farmers can use to analyze their crop state since it measures the level of greenness and biomass of vegetation. This means the higher the NDVI value, the greener and healthier the plants are.

NDVI and Satellite Crop Monitoring
NDVI measures the density of vegetation, which lets farmers assess plant growth, presence of weeds or diseases, and even predict yields. Getting such analytics, farmers become way more informed about their plants in different field areas. Most importantly, they get an opportunity to react to any changes in a timely manner and prevent yield losses. There are also other VIs that can and should be used by farmers that want to analyze vegetation. Good examples of other popular vegetation indices would be NDRE, MSAVI, RECI, and NDMI. Since every index is calculated differently and reveals different aspects of Earth’s surface, it’s better to use them in combination. Using several vegetation indices enables farmers to see a more complex picture of the field and compare values of different indices with each other to make more accurate assumptions on crops and soil state.
The best and easiest way to start leveraging vegetation data is by using an online tool that provides index values for already analyzed vegetation based on the latest satellite imagery. For instance, the users of EOS Crop Monitoring online agro platform can access data on NDVI, NDRE, MSAVI, ReCI, and NDMI values to have different perspectives on crops health at a certain growth stage. Besides, the application not only shows vegetation data but leverages it to create field productivity maps, automatically identifying field zones with higher or lower average productivity. Based on this data, farmers can determine how much K and P fertilizer must be distributed across the field to maximize growth efficiency. And the functionality of the tool doesn’t end there. Identifying the problem areas within a field that are the least productive and show poor vegetation state, farmers can remotely assign a scout to inspect this particular field zone. This saves time on both detecting the issue and taking care of it in the most efficient scouting management way possible.
Overall, using NDVI and other vegetation indices is great for field monitoring and fast and effective crop management. It offers a variety of opportunities for farmers, enabling them not only to save time on manual crops inspection but also increasing profits due to a more efficient resources management that is based not on assumptions but on accurate and relevant data.

